Help

Text and Images from Slide

www.TecAccess.net

7

Facebook

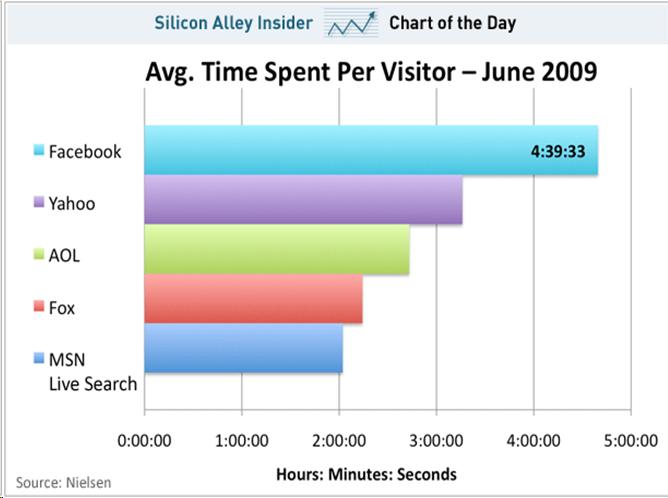
Within this growing segment, the average Facebook user in June 2009, for example, spent close to 4.5 hours (Nielsen Ratings) on the platform. That's over an hour more than the average user spent using Yahoo.

Bar graph of the Avg. Time Spent Per Visitor for June of 2009. It is as follows: Aqua = Facebook - 4:39:33 Purple = Yahoo - over 3:00:00 Green = AOL - over 2?:00:00 Pink = Fox - over 2:00:00 ( but less than AOL) Blue = MSN Live Search - 2:00:00 This is shown in Hours:Minutes:Seconds

View all slides | Contents of this slide